.png)
.png)

Daniel Saks
Chief Executive Officer


Every B2B sales team filters accounts by firmographics: industry, company size, revenue range, geography. The problem is that firmographic filtering treats every company in a segment identically. A 500-person SaaS company in a hiring freeze and a 500-person SaaS company that just raised Series C and is hiring ten SDRs both pass the same filter. One is a strong prospect. The other is not worth a call this quarter.
Propensity scoring separates them. According to Forrester research on B2B revenue operations, companies that use predictive scoring in their outbound motion achieve 30-40% higher conversion rates from initial contact to qualified opportunity. According to McKinsey research on B2B digital selling, the precision of account targeting is the single highest-leverage variable in outbound pipeline generation.
The baseline: does this company match the profile of your typical customer? Industry, employee count, revenue range, headquarters location, and company structure. Firmographic fit is necessary but insufficient. It defines the addressable market. It does not rank within it. According to Gartner research on sales intelligence, firmographic-only targeting produces conversion rates 40-60% lower than multi-signal targeting.
What technology does the company use? The technology stack reveals budget allocation patterns, operational maturity, and compatibility with your product. A company using Salesforce, Outreach, and Gong has invested in sales infrastructure. A company using spreadsheets and email has different priorities. Technology adoption signals are among the strongest predictors of B2B purchasing behavior according to Harvard Business Review research on enterprise selling.
Is the company growing, stable, or contracting? Hiring velocity, revenue growth, office expansion, and product launches all indicate whether the company is investing. Growing companies buy more tools. According to Bain research on B2B growth, companies in active growth phases are 3x more likely to evaluate new technology purchases than stable companies of the same size.
Signals that indicate the company is actively evaluating or ready to buy: a new VP of Sales hired in the last 90 days, a funding round closed in the last six months, a competitor product dropped, a relevant job posting published. These timing indicators separate companies that could buy from companies that are ready to buy now. See buying signals that predict pipeline for a detailed breakdown.
If the company has previously engaged with your content, visited your website, attended a webinar, or responded to outreach, that behavioral data increases propensity. Prior engagement indicates awareness and some level of interest. In outbound-first motions, this dimension may have limited data for net-new accounts, but it should be included when available.
Pull every closed-won deal from the last 12 to 18 months. For each account, capture every available dimension: firmographics, technology stack, hiring activity at the time of purchase, funding history, and the signal that triggered the initial outreach. The patterns across 50 or more closed-won accounts reveal which dimensions are actually predictive for your specific market. See the ICP definition framework for a structured approach.
Assign point values to each dimension based on its correlation with closed-won outcomes. If 80% of your closed-won accounts used Salesforce, the Salesforce technographic signal gets a high weight. If hiring velocity had no correlation with conversion, it gets a low weight or is removed. The weights should be data-derived, not assumption-based.
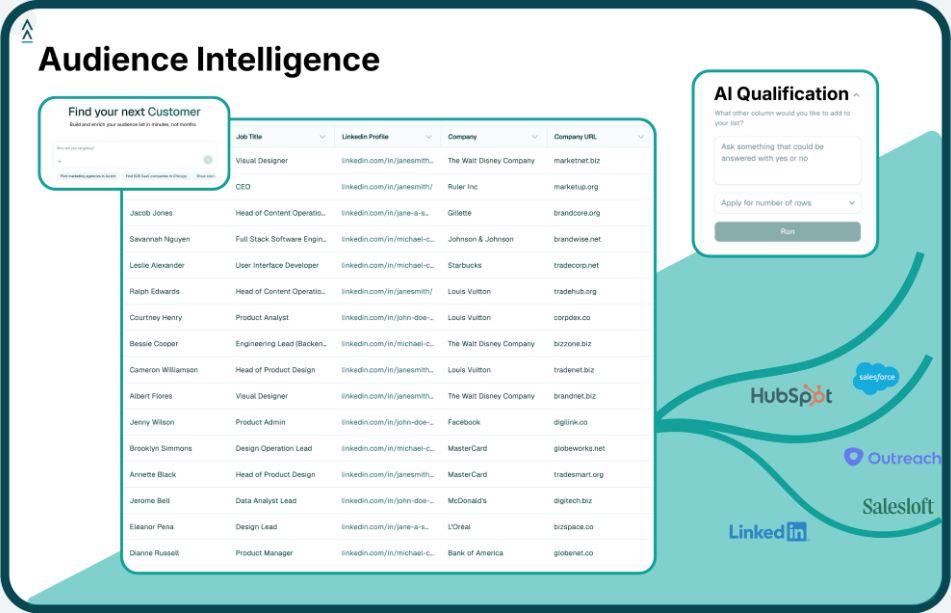
Apply the weighted model across the entire addressable market. Every company receives a composite score. Tier the results: A-tier (top 10-15%, highest propensity), B-tier (next 20-25%, strong fit with fewer signals), C-tier (remaining qualified accounts that may require additional verification). Landbase runs this scoring across 24M+ companies using 1,500+ data points per account and exports the results as a tiered CSV. For how to use this scored output, see the TAM mapping guide.
Each tier receives a different outreach treatment. A-tier accounts get multi-channel, multi-threaded campaigns with personalized messaging. B-tier accounts get standard outbound sequences. C-tier accounts enter a monitoring queue where signal changes (new funding, key hire, tech migration) can promote them to a higher tier. This tiered approach allocates rep capacity where it has the highest expected return.
After each outreach cycle, compare conversion rates by tier and by individual scoring dimensions. If B-tier accounts in a specific vertical converted at higher rates than A-tier accounts in another vertical, the model needs adjustment. The recalibration cadence should match the outreach cadence: if campaigns run monthly, recalibrate monthly. According to Salesforce research on high-performing sales teams, data-driven teams that recalibrate their targeting criteria regularly outperform static-model teams by 2x or more on pipeline generation per rep.
You need a minimum of 30 to 50 closed-won accounts to identify meaningful patterns. Below that, the sample is too small for statistical confidence. If you have fewer than 30 closed-won accounts, start with a hypothesis-based model weighted toward your ICP criteria and refine it as conversion data accumulates. ML-powered lookalike expansion from even a small set of seed accounts can identify directionally accurate patterns.
Intent data measures whether a company is actively researching a topic (based on content consumption signals from third-party networks). Propensity scoring measures whether a company fits the profile of companies that convert (based on firmographic, technographic, and behavioral attributes). Intent data is a timing signal. Propensity is a fit signal. The most effective models combine both: high-propensity accounts showing active intent signals are the highest-priority targets.
No. ICP definition determines which companies are in the addressable market. Propensity scoring ranks the companies within that market by likelihood to convert. The ICP is the filter. The propensity model is the prioritizer. Both are necessary. See account scoring vs. lead scoring for how these concepts relate.
Landbase builds propensity models from your closed-won data, scores the full addressable market, and exports tiered account lists as clean CSVs. Each account includes the composite propensity score, the individual dimension scores, and the tier classification. The model persists between cycles and can be recalibrated with conversion data from each outreach campaign.

Tool and strategies modern teams need to help their companies grow.