.png)
.png)

Daniel Saks
Chief Executive Officer


Ask an enterprise sales leader how big their addressable market is and you will get one of two answers: a number from an analyst report that has no connection to their territory plan, or a CRM account count that reflects what the team has found so far rather than what exists. Neither answer is useful for deciding where to invest headcount, which segments to prioritize, or how much penetration the team has achieved.
According to McKinsey research on growth strategy, companies that define their addressable market with precision grow two to three times faster than those using rough estimates. The difference is whether the TAM is a number on a board slide or a scored database that drives daily sales activity.
According to Bain research on B2B sales growth, the highest-performing enterprise sales teams have a shared, quantified view of their market that aligns territory planning, headcount allocation, and segment prioritization. Teams without this view make those decisions based on intuition and historical patterns that may no longer reflect the market.
A database query for 'software companies with 500+ employees in the United States' returns thousands of results. But that list treats a high-growth Series C company hiring SDRs the same as a legacy enterprise in a hiring freeze. According to Forrester research on B2B revenue operations, the ability to prioritize accounts by propensity is what separates high-performing outbound teams from average ones. A list without scoring is a phonebook.
The typical enterprise CRM contains the accounts reps have encountered through inbound leads, trade shows, referrals, and manual prospecting. That is a subset of the market, shaped by where the team has looked rather than where the opportunity actually sits. According to Harvard Business Review research on sales effectiveness, enterprise sales teams that map their full addressable market identify 30-50% more viable accounts than those working from CRM data alone.
A TAM built in January is partially wrong by April. Companies get acquired, go public, pivot into new markets, change technology stacks, and hire or fire the roles that matter to your buyer persona. According to research on B2B data quality, contact data decays at 20-30% annually. The underlying company data shifts even faster in high-growth segments. A static TAM gives the team false confidence in numbers that no longer reflect reality.
Pull every closed-won deal from the last 12 to 18 months. For each account, capture: industry, company size, revenue, technology stack, funding stage, growth trajectory, and the signal that triggered the deal. The patterns across these deals become the scoring criteria. If 70% of closed-won accounts were Series B to D companies using Salesforce with recent RevOps hires, those become high-weight scoring factors. See the ICP definition framework for a detailed methodology.
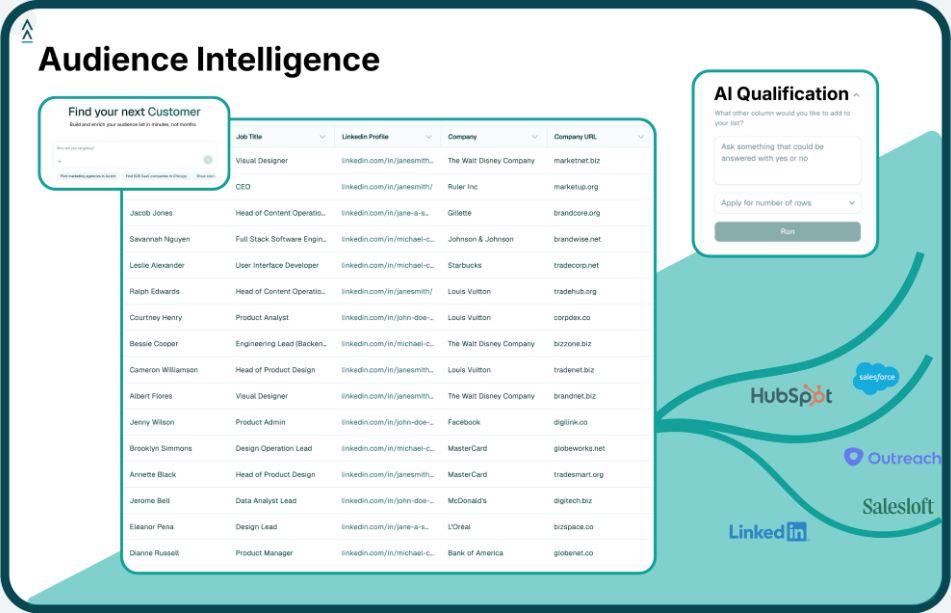
Apply the scoring criteria across the entire addressable market using AI-powered qualification. Every company receives a composite score based on how closely it matches the closed-won patterns. Tier the results: A-tier accounts match across multiple dimensions and receive immediate outreach. B-tier accounts match on firmographics but lack signal confirmation. C-tier accounts show potential but require AI verification before entering the pipeline.
Your closed-won accounts are seeds for ML-powered expansion. Lookalike models identify companies with similar attributes that the team has not found in any database. According to Gartner research on sales intelligence, AI-powered account identification surfaces 30-40% more viable targets than firmographic filtering alone. This closes the gap between CRM coverage and market reality. Landbase runs this expansion across 24M+ companies and 1,500+ data points per account.
With a scored TAM, every performance metric has a denominator. Penetration rate by vertical, by tier, and by territory becomes visible. Leadership can answer: what percentage of A-tier accounts have we touched? Which vertical has the most untouched opportunity? Where should the next SDR headcount go? These questions are unanswerable without a scored TAM.
The TAM should re-score continuously as companies change. New funding rounds, leadership hires, technology migrations, and market shifts all affect propensity scores. A quarterly re-score is the minimum. Continuous re-scoring tied to signal data is ideal. The TAM that drives territory planning in Q4 should reflect the market as it exists in Q4, not as it existed when the TAM was first built.
Territory assignment becomes a quantitative exercise. Each rep receives a book of business drawn from the scored TAM with balance across tiers, segments, and company sizes. The debate about whether territories are 'fair' is replaced by data showing exactly how many A-tier accounts each rep has.
The TAM becomes the reporting infrastructure. Market penetration by segment, pipeline coverage against the scored opportunity, and conversion rates by tier all flow from the same scored database. Leadership reports on progress against a shared number rather than a moving target. For related metrics, see the RevOps KPI dashboard.
Hiring decisions are backed by evidence. If the HVAC vertical has 2,000 A-tier accounts and 85% penetration while the electrical vertical has 1,800 A-tier accounts and 30% penetration, the next hire goes to the electrical team. Without a scored TAM, this decision is made on gut feeling.
A database subscription gives you access to company records. TAM mapping scores those records against your specific ICP criteria, tiers them by propensity, and expands the universe with lookalike modeling. The difference is between a phonebook and a prioritized target list. Most database subscriptions provide the raw material. The scoring, tiering, and expansion layer is what makes it actionable.
With AI-powered scoring, a full TAM can be scored, tiered, and exported within days. The elapsed time depends on the complexity of the ICP criteria and the number of verticals or segments. Enterprise engagements with multiple segments and thousands of accounts have been delivered in approximately ten days of active build time.
Building the scoring model requires data science capability, access to comprehensive firmographic and technographic data, and the infrastructure to re-score continuously. Most enterprise teams have the domain knowledge to define ICP criteria but lack the data access and ML infrastructure to score it across the full market. A platform like Landbase combines the data, the scoring engine, and the export pipeline into a single workflow.
Landbase builds a scored, tiered TAM using your closed-won data as seeds, ML-powered lookalike expansion to surface net-new accounts, and AI qualification across 1,500+ data points per company. The output is a clean CSV with every account scored, tiered, and ready for territory assignment and CRM import. The scoring model persists and re-scores as the market moves.

Tool and strategies modern teams need to help their companies grow.