.png)
.png)

Daniel Saks
Chief Executive Officer


Territory planning is the RevOps project that makes or breaks the sales year. Get it right and reps have balanced opportunity, fair quotas, and clear ownership. Get it wrong and top performers leave, underperformers hide behind bad territories, and attribution becomes a constant argument.
Most territory plans fail because they are built on incomplete data. A territory defined by geography with no consideration for TAM potential, signal density, or existing customer concentration creates imbalances that undermine the entire sales motion.
Each territory needs a comparable number of ICP-fit accounts weighted by revenue potential. A territory with 500 accounts that are all SMB is different from one with 500 accounts that include 50 enterprises. Raw account count creates false balance.
To calculate TAM potential per territory: count ICP-fit accounts, multiply by average deal size for each segment, and sum to get total addressable revenue per territory. Balance territories by addressable revenue, not account count.
Not all accounts are equally ready to buy. Some are showing active buying signals (hiring, funding, technology changes, intent data) while others are dormant. Territories with high signal density will generate more pipeline than territories with the same TAM but fewer active signals.
Layer signal data on top of TAM data when designing territories. A territory with $10M addressable revenue and 30% signal density is more productive than one with $15M addressable revenue and 5% signal density.
Existing customers affect territory value in two ways. They create expansion revenue opportunity (upsells and cross-sells) and they reduce the net-new TAM (accounts already won). Both need to be factored in.
A territory with a large existing customer base has expansion potential but less room for new logos. A territory with no existing customers has higher new-logo potential but no expansion base. Balance both dimensions.
Match territory complexity to rep capability. Enterprise territories with complex deal cycles should go to experienced reps. High-velocity SMB territories should go to reps who can handle volume. Mismatching territory type to rep skill is a common cause of underperformance.
Before designing territories, you need a complete picture of your addressable market. Identify every account that matches your ICP, enriched with firmographic, technographic, and signal data.
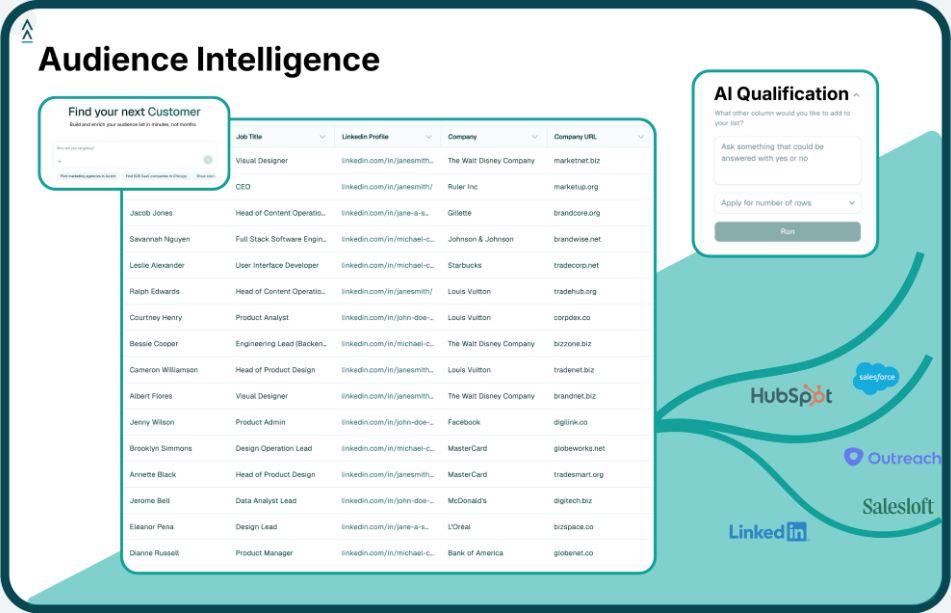
Platforms like Landbase deliver this by scanning 24M+ companies across 1,500+ enrichment fields. The output is a complete TAM list with the data needed for territory segmentation.
Group accounts into tiers based on estimated deal value. Enterprise accounts (500+ employees) in one tier, mid-market (100-500) in another, SMB (under 100) in a third. Calculate total addressable revenue per tier.
Add signal density to each account: recent funding, hiring for roles in your buyer persona, technology changes, and intent data. Accounts with active signals are worth more in territory planning because they convert at higher rates.
Use the combined data (TAM potential + signal density + customer footprint) to draw territory boundaries that balance opportunity across reps. This usually means geographic territories are not equal in area but are equal in addressable, signal-weighted revenue.
Match territory complexity to rep experience. Assign quotas based on territory potential, and make sure every rep can see their territory composition so they trust the plan.
Markets shift. Accounts move in and out of your ICP. Signals change. Reps join and leave. Review territory balance quarterly and make adjustments before imbalances compound.
A rep covering the entire West Coast and a rep covering the Northeast may have wildly different TAM potential. Geography is convenient for assignment but poor for balance. Always weight geographic territories by TAM data.
500 SMB accounts and 500 enterprise accounts are very different territories even though the account count is the same. Weight by deal size, not account count.
Two territories with equal TAM can produce very different pipeline if one has 3x the signal density. Active signals predict pipeline. Dormant accounts do not. Factor signal density into territory value calculations.
Markets move faster than annual plans. Quarterly reviews catch imbalances before they cause quota misses and rep turnover.
Depends on your sales motion. Enterprise reps typically manage 50-200 accounts. Mid-market reps manage 200-500. High-velocity SMB reps manage 500-2,000. The key is that each territory has comparable addressable revenue, not comparable account count.
Generally no. Overlapping territories create conflict and confusion. The exception is named account programs where a strategic rep overlays a territory rep on specific high-value deals.
Minimize mid-year changes because they disrupt relationships and pipeline. When changes are necessary (rep departure, acquisition, new product launch), make them at quarter boundaries and adjust quotas accordingly.
Most teams use a combination of their CRM (Salesforce or HubSpot for account data), a mapping tool (Fullcast, Gradient Works, or spreadsheets), and a data platform (Landbase for TAM data and signals). The data quality of the underlying accounts determines the quality of the territory plan.

Tool and strategies modern teams need to help their companies grow.