.png)
.png)

Daniel Saks
Chief Executive Officer


Your total addressable market is only as good as the data behind it. Yet most B2B teams still rely on static spreadsheets, outdated firmographic filters, and annual market-sizing exercises that go stale within weeks. B2B contact data decays at 2.1% per month — compounding to roughly 22.5% of records going stale every year — which means a TAM built in January is already missing nearly a quarter of its accuracy by December. If you are evaluating the best TAM identification tools in 2026, the landscape has shifted dramatically — agentic AI, real-time buying signals, and enrichment databases with 1,000+ fields now make it possible to build a living TAM that updates continuously and converts directly into pipeline.
The stakes are not theoretical. In CB Insights' analysis of 101 startup postmortems, lack of market need was the most commonly cited factor, appearing in 42% of cases. Teams that revisit TAM assumptions more frequently are generally better positioned to respond to market changes and attract investor confidence. Choosing the right tam identification software is no longer a nice-to-have — it determines whether your sales team pursues the right accounts or wastes cycles on prospects that will never close.
With the global sales intelligence market reaching $5.37 billion in 2026 (growing at 11.10% CAGR) and the AI-in-sales market projected to hit $145 billion by 2033, the tools available for TAM identification are expanding faster than any previous cycle. We evaluated 11 total addressable market tools across data coverage, enrichment depth, signal detection, AI capabilities, and integration ecosystem. Below is the complete breakdown — starting with the platform that turns TAM identification into an automated, end-to-end pipeline.
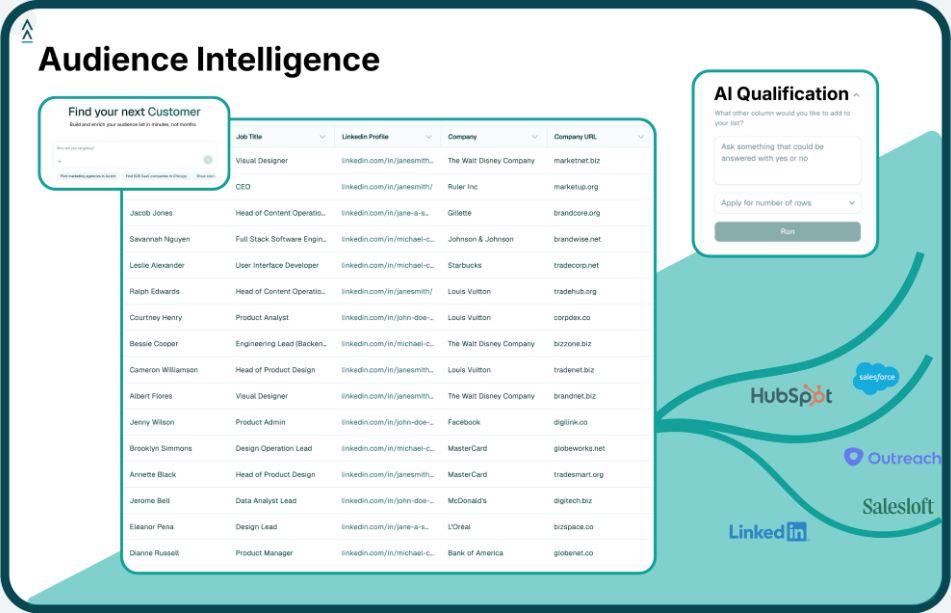
Landbase is the world's first agentic AI platform for go-to-market — and it approaches TAM identification fundamentally differently than every other tool on this list. Instead of handing you a static database and leaving you to filter, enrich, qualify, and activate accounts manually across multiple tools, Landbase's AI agents handle the entire workflow autonomously: identify your total addressable market from an extensive database of verified contacts, qualify accounts using real-time buying signals across hundreds of enrichment fields, and activate personalized outreach sequences — all from a single platform.
The difference between Landbase and traditional TAM tools comes down to what happens after you define your market. Most tam identification software stops at the list. Landbase's Research Agent, Identity Agent, and Predictive Agent work together to build what the platform calls a "living TAM" — a continuously updated view of your addressable market that reflects real-time signals like hiring patterns, technology adoption, funding events, and engagement behavior. This is a fundamental shift from the annual market-sizing snapshot that most teams still rely on, and it means your TAM adapts as your market moves.
The depth of Landbase's enrichment layer is a core differentiator for TAM accuracy. With 1,500+ enrichment fields spanning firmographic, technographic, intent, and behavioral data, you can build TAM segments that go far beyond basic industry-and-employee-count filters. The GTM-2 Omni model scores and ranks accounts based on signal-qualified fit — so your team focuses on accounts showing active buying behavior, not just accounts that match a static ICP definition.
For teams looking to scale prospecting without adding headcount, the end-to-end automation is the differentiator.
Key features:
Best for: B2B sales teams and RevOps leaders who need to identify, qualify, and activate their TAM in one platform — without assembling a multi-tool stack.
Credibility: Recognized as a Gartner Cool Vendor. Backed by a $30M Series A.
ZoomInfo is an enterprise-grade B2B intelligence platform that has built one of the largest proprietary databases in the market. The platform tracks 30,000+ technologies across 100M+ companies, combining firmographic data, technographic intelligence, buyer intent signals, and organizational hierarchy mapping into a single interface for TAM analysis. With over 12,800 G2 reviews, it remains one of the most widely adopted B2B data platforms in the market.
For TAM identification specifically, ZoomInfo's strength is data breadth. Teams can filter accounts by technology stack, employee count, revenue range, industry, location, and dozens of other firmographic attributes. The platform's intent data layer adds a qualification dimension, surfacing accounts that are actively researching topics related to your product category. The tradeoff is complexity and cost — ZoomInfo's enterprise pricing and multi-product suite require dedicated RevOps resources to extract full value, and smaller teams often find the learning curve steep relative to their data needs.
Key features:
Best for: Large enterprises with dedicated RevOps teams who can manage complex workflows and have budget for premium data.
Pricing: Custom pricing; contact ZoomInfo for a quote.
G2 Rating: 4.5/5 (12,832 reviews)
6sense is an AI-powered ABM and revenue intelligence platform that approaches TAM identification through predictive analytics and account scoring. The platform combines technographic data with buyer intent signals from multiple sources — tracking website visits, third-party research activity, and technology installations to identify accounts that are showing active buying behavior. Demandbase's 2024 ABM Benchmark reports that top B2B marketers are achieving 81% higher ROI with ABM, underscoring why the predictive ABM category has become a core layer in enterprise TAM workflows.
The platform's primary TAM use case is account prioritization. Rather than building a static list of companies that match your ICP, 6sense scores and ranks accounts based on predicted buying stage and fit. This helps teams focus resources on accounts that are actively in-market, rather than distributing effort evenly across an undifferentiated TAM. The platform also supports automated audience activation across advertising, email, web, and sales tools.
Key features:
Best for: Mid-market to enterprise B2B teams running account-based strategies who need predictive TAM scoring and multi-channel orchestration.
Pricing: Custom pricing; contact for quote.
G2 Rating: 4.3/5 (1,356 reviews)
Demandbase One is an account-based GTM platform built for B2B enterprises. The platform identifies and targets accounts matching your ideal customer profile using its proprietary Qualification Score, which combines firmographic fit, engagement signals, and intent data into a single metric. For TAM identification, Demandbase bridges known and anonymous web visitors with real-time identification and provides a unified view of intent data with prescriptive actions.
The platform's approach to TAM is account-centric rather than contact-centric. It focuses on identifying which companies fit your market, how engaged they are, and what actions your team should take next. This makes it particularly relevant for marketing and sales teams that operate with an ABM motion and need account-level intelligence rather than individual contact lists.
Key features:
Best for: Enterprise B2B marketing and sales teams running ABM programs who need account-level TAM intelligence with prescriptive next-best actions.
Pricing: Custom enterprise pricing; contact for quote.
G2 Rating: 4.4/5 (1,936 reviews)
HG Insights is a technology intelligence platform widely used by Fortune 100 B2B tech companies. The platform provides granular data on IT installations, spend, contracts, and intent — enabling TAM sizing by IT spend, tech installs, and other customizable criteria. For teams selling technology products, HG Insights offers a TAM methodology centered on actual technology adoption rather than generic firmographic estimates.
The platform's vendor penetration and market share analysis is a differentiator for displacement selling strategies. If your product replaces or integrates with specific technologies, HG Insights can quantify exactly how many companies are currently using the incumbent solution, what they are spending, and when their contracts renew — creating a TAM defined by replacement opportunity rather than broad market categories.
Key features:
Best for: B2B tech companies and strategy teams who need technology-driven TAM analysis with deep vendor penetration insights — ideal for displacement selling.
Pricing: Custom enterprise pricing; contact for quote.
G2 Rating: 4.3/5 (428 reviews)
Cognism is a GDPR-compliant B2B data intelligence platform with particular strength in European markets. The platform combines technographic intelligence — tracking software installations, cloud infrastructure, and business applications — with verified contact data and firmographic details. For teams building TAM in the EU or UK, Cognism's compliance-first approach eliminates the data sourcing risk that comes with using platforms not designed for European privacy regulations.
Cognism's Diamond Data feature provides phone-verified mobile numbers, which adds a contact-level quality layer to TAM identification. The platform also integrates Bombora intent data, enabling teams to prioritize accounts within their TAM that are actively researching relevant topics.
Key features:
Best for: B2B teams targeting European markets or operating under strict data compliance requirements who need GDPR-safe TAM identification.
Pricing: Custom pricing based on seats and data access; contact for quote.
G2 Rating: 4.5/5 (1,317 reviews)
Dealfront is a European-focused B2B go-to-market platform formed from the merger of Leadfeeder and Echobot. The platform includes a dedicated TAM Calculator that identifies your total addressable market in seconds using filters for location, industry, and employee count. It supports the full GTM cycle — Discover, Qualify, Convert, and Optimize — with firmographic filtering and website visitor identification.
For teams focused on European markets, Dealfront's database strength in the DACH region (Germany, Austria, Switzerland) stands out — particularly for teams that need German-language company data and local business registry integrations. Dealfront offers tiered and customized pricing, and Leadfeeder has free/trial access, which lowers the barrier for SMBs and mid-market teams that do not want to commit to five-figure annual contracts just to size their addressable market.
Key features:
Best for: SMBs and mid-market teams focused on European markets who want quick TAM estimation with built-in visitor tracking and lead qualification.
Pricing: Tiered/customized pricing; plans vary by module (Leadfeeder free tier available).
G2 Rating: 4.3/5 (Dealfront; note that Dealfront and Leadfeeder maintain separate G2 review profiles)
Clay is a data enrichment and workflow automation platform trusted by 300,000+ GTM teams. The platform accesses 150+ premium data providers through a single interface, using waterfall enrichment that cascades across sources to maximize data coverage on any given account or contact. Clay crossed $100M ARR in 2025, reflecting strong adoption among growth and RevOps teams.
For TAM identification, Clay's value is flexibility. Teams can build custom enrichment workflows that pull firmographic, technographic, and intent data from dozens of sources, then apply scoring logic and filters to define their addressable market. The tradeoff is that Clay is a toolkit — it provides the building blocks for TAM identification but requires manual workflow assembly rather than end-to-end automation.
Key features:
Best for: Growth teams and RevOps operators who want flexible enrichment workflows and can invest time in building custom TAM identification sequences.
Pricing: Launch: $185/mo; Growth: $495/mo; Enterprise: custom.
G2 Rating: 4.9/5 (192 reviews)
Clearbit is a B2B data enrichment platform acquired by HubSpot for $150M, now integrated as Breeze Intelligence within the HubSpot ecosystem. The platform enriches every contact or company record with over 40 firmographic, demographic, and technographic attributes — including technologies installed, employee count, revenue, and location — enabling TAM segmentation directly within HubSpot's CRM and marketing automation tools.
For HubSpot-native teams, Clearbit's integration advantage is significant. TAM filtering, enrichment, and activation all happen inside the platform the team already uses. IP intelligence identifies website visitor companies, and dynamic form shortening uses autofill to reduce friction while capturing firmographic data. The tradeoff is ecosystem lock-in — teams not using HubSpot get less value from the integration-centric approach.
Key features:
Best for: HubSpot-native teams who want seamless enrichment and TAM filtering integrated directly into their existing CRM and marketing stack.
Pricing: Pricing depends on your HubSpot subscription and HubSpot Credits usage; some functionality is included with HubSpot subscriptions, and additional credits can be purchased separately.
G2 Rating: 4.4/5 (629 reviews)
Scalepath is a purpose-built B2B TAM analysis platform that combines software with expert guidance. The platform leverages millions of data points on real businesses globally to help size markets and identify growth avenues. Unlike the other tools on this list — which focus on contact-level or account-level TAM data — Scalepath is designed specifically for market-level TAM modeling with investor-grade outputs.
For founders and strategy leaders preparing for fundraising or board presentations, Scalepath produces TAM/SAM/SOM models that export directly to PowerPoint and Excel. The platform offers both a self-service software tier and an expert-built tier where consultants construct the models for you.
Key features:
Best for: Founders, strategy teams, and operators who need investor-ready TAM/SAM/SOM models and board-grade market sizing reports.
Pricing: DIY software: $1,188/year; Expert-built models: starting at $9,000.
G2 Rating: Not rated (newer platform)
Factors.ai is an AI-powered ABM and account intelligence platform that identifies 75%+ of companies visiting your website. The platform tracks how accounts move across pages, channels, and campaigns with multi-touch attribution and custom engagement scoring for TAM activation.
For teams that want to define TAM from observed behavior rather than purchased data, Factors.ai inverts the typical workflow. Instead of starting with a list and hoping those accounts are interested, you start with companies already visiting your site, score their engagement depth, and build outward from demonstrated interest. The G2 Buyer Intent integration adds a third-party signal layer so you catch accounts researching your category even before they land on your domain.
Key features:
Best for: Marketing teams who want to identify and score accounts already showing interest via website visits and third-party intent, then activate them across paid channels.
Pricing: Free tier available; Basic, Growth, and Enterprise tiers based on accounts identified.
G2 Rating: 4.5/5 (179 reviews)
Before selecting a TAM identification tool, it helps to understand the three established calculation methodologies — because the best tools operationalize at least two of them, and the strongest platforms automate all three.
Top-down analysis starts with broad industry reports from firms like Gartner, Forrester, or IDC and narrows the total market by applying geographic, demographic, and segment filters. It is the fastest method and useful for early-stage sizing, but it relies on third-party estimates that may be outdated or overly broad. A top-down approach to the global cybersecurity market, for example, yields a range of $1.5 trillion to $2.0 trillion — a spread so wide it is nearly useless for account-level targeting.
Bottom-up analysis starts with your product's unit economics — number of potential customers that match your ICP multiplied by average annual contract value (ACV). If 100,000 companies fit your firmographic and technographic criteria and your ACV is $500, your bottom-up TAM is $50 million. This method is preferred by investors because it is grounded in verifiable data rather than analyst estimates. The tradeoff is that it requires granular company-level data — which is exactly where TAM identification tools add the most value.
Value-theory analysis estimates TAM based on the value your product delivers and what buyers would rationally pay. For a surgical AI tool that saves hospitals $20,000 annually across 10,000 eligible facilities, the value-based TAM is $200 million — regardless of what the market currently spends on incumbent solutions. This approach is most relevant for disruptive products entering markets where no direct comparison exists.
The best tam identification software supports bottom-up TAM natively by providing the enrichment data (firmographic + technographic + intent) needed to count qualifying accounts accurately. Platforms like Landbase go further by automating the entire bottom-up workflow — identifying accounts that match your ICP, scoring them by signal-qualified fit, and activating the highest-value segments without manual list building.
Even with the right tools, TAM identification fails when teams make these avoidable errors:
1. Confusing TAM with SAM and SOM. TAM is the total revenue opportunity at 100% market capture. SAM narrows that to the segment you can realistically serve. SOM is what you can actually capture given competition and capacity. Conflating these three metrics is one of the most damaging errors in business planning — especially when pitching investors. Early SOM assumptions should be conservative and grounded in historical win rates, sales capacity, competition, and channel reach.
2. Building TAM once and never updating it. B2B data decays at 2.1% per month. Professionals change jobs, phone numbers go stale, and email addresses become invalid at significant rates each year — with some estimates suggesting 22.5% to 30% of records degrade annually. A TAM built in Q1 is already materially inaccurate by Q3. The fix: choose a platform with continuous enrichment and real-time signal updates rather than static list exports.
3. Relying on firmographics alone. Industry, employee count, and revenue range are necessary but insufficient filters. Two companies in the same industry with the same headcount can have completely different technology stacks, buying intent levels, and budget authority structures. Platforms offering technographic, behavioral, and intent enrichment produce TAM segments that actually convert to pipeline.
4. Overestimating market capture rates. Overestimating TAM can materially distort hiring, product development, and investor-planning decisions. Cross-validate your TAM using at least two of the three calculation methods above, and pressure-test your SOM assumptions against historical conversion data.
5. Ignoring data compliance in target markets. If you sell into the EU, your TAM data sourcing must be GDPR-compliant. Using non-compliant data providers creates legal exposure that can dwarf the revenue opportunity. Ensure your tool's data collection methodology meets the regulatory requirements of every geography in your TAM definition — not just your home market.
Most B2B teams still build TAM the same way they did in 2019: pull an industry report, estimate total market size, apply firmographic filters, and hand a static spreadsheet to sales. That spreadsheet starts decaying the moment it is saved. Companies raise rounds, pivot products, hire new leadership, adopt new technologies, and enter new markets — none of which shows up in a quarterly refresh cycle. The financial cost of this approach is measurable: poor data quality has been estimated to cost the U.S. economy roughly $3 trillion annually, with Gartner-cited secondary reporting putting the average organizational cost near $12.9 million per year through wasted marketing spend, lost sales opportunities, and operational inefficiencies.
A living TAM — the approach pioneered by platforms like Landbase — treats your addressable market as a dynamic dataset that updates continuously based on real-time signals. Hiring activity, technology adoption, funding rounds, engagement behavior, and intent data all flow into the TAM definition, adding and removing accounts as conditions change. AI-powered tools can significantly boost B2B campaign results through predictive analytics and real-time performance monitoring — and TAM identification is one of the highest-leverage applications of this capability.
With the global MarTech market projected to reach $669B in 2026 and the B2B data enrichment tool market estimated at $7.6 billion in 2025 growing to $17.5 billion by 2035 at an 8.75% CAGR, the tools available for dynamic TAM management are expanding rapidly. Teams selling into niche B2B markets see particularly strong returns from signal-driven TAM, since smaller markets demand precision over volume.
For a deeper comparison of these two approaches, see Static TAM vs. Living TAM: Signals-Based TAM Explained.
Eleven tools, four distinct approaches (databases, ABM platforms, enrichment workflows, and agentic AI). The right pick depends on your team size, automation appetite, and where you sell. Use the TAM Tool Evaluation Framework below to score each platform against your requirements — then compare weighted totals rather than gut feel.
Here is what each criterion means in practice:
Data depth and enrichment fields. The more attributes you can filter on, the more precise your TAM. Basic firmographic filters (industry, size, location) produce broad, undifferentiated lists. Platforms offering 1,000+ enrichment fields — including technographic, behavioral, and intent data — produce TAM segments that go beyond basic firmographics and actually convert.
Signal coverage and freshness. Static databases decay. Evaluate how frequently each platform updates its data and whether it incorporates real-time buying signals.
Automation level. Some tools give you raw data and leave the workflow to you. Others automate enrichment, qualification, scoring, and even outbound sales activation. If your team is lean, an end-to-end platform eliminates the need to stitch together multiple point solutions.
Integration ecosystem. A TAM tool that does not connect to your CRM, marketing automation, and outreach stack creates a data silo on day one. Native integrations reduce manual CSV exports and keep your TAM in sync across systems — so changes in your enrichment data propagate to sales workflows without manual intervention.
Compliance requirements. If you sell into European markets, GDPR compliance in your data sourcing is non-negotiable. Ensure the platform's data collection methodology meets the regulatory requirements of your target markets.
Scalability. Your TAM process needs to grow with your company. Many teams discover that TAM sourcing breaks after Series A because their tooling cannot handle expanding markets and ICPs. Choose a platform that scales without requiring a dedicated analyst team — or read how RevOps teams build a defensible TAM without analysts using automated approaches.
Different teams need different TAM tools. Here is a quick reference based on common B2B scenarios:
For most B2B teams in the growth stage, the bottleneck is not finding accounts — it is connecting TAM identification to pipeline generation without assembling a five-tool stack. This is the core use case where end-to-end GTM automation delivers the highest ROI.
The TAM identification landscape in 2026 is defined by a clear divide: tools that produce static lists and tools that build living, signal-driven markets. With the AI-in-sales market growing at 22.2% CAGR toward $145 billion by 2033, investing in the right TAM identification platform is one of the highest-leverage decisions a revenue team can make. TAM calculations that worked in 2023 are already obsolete in 2026's AI-transformed business landscape — recalculating with modern tools is not optional.
For most B2B teams, Landbase represents the strongest option because it is the only platform that closes the gap between TAM identification and pipeline generation. With 300M+ contacts, 1,500+ enrichment fields, real-time buying signals, and agentic AI that automates the entire workflow from TAM sourcing through personalized outreach, Landbase eliminates the multi-tool assembly that slows down every other approach and connects TAM identification directly to revenue outcomes.
TAM identification is the process of defining and quantifying the total set of companies or individuals that could potentially buy your product or service. In B2B, this typically involves filtering a database of companies by firmographic criteria (industry, size, revenue, location), then layering technographic data, intent signals, and other enrichment attributes to narrow the market to accounts that fit your ideal customer profile. The output is a qualified list of target accounts that represents your total addressable market.
There are three primary methods. Top-down uses industry reports and market research to estimate total market size, then applies filters to narrow the scope. Bottom-up starts with your product's unit economics — price per customer multiplied by the number of potential customers that match your ICP — and builds upward. Value theory estimates TAM based on the value your product delivers and what buyers would rationally pay. For B2B sales teams, the bottom-up approach using first-party data and enrichment tools tends to produce the most actionable results.
TAM (Total Addressable Market) is the entire revenue opportunity available if you captured 100% of the market. SAM (Serviceable Addressable Market) narrows TAM to the segment you can realistically reach with your current product, pricing, and distribution. SOM (Serviceable Obtainable Market) is the portion of SAM you can realistically capture in a given timeframe, accounting for competition and capacity constraints. Effective B2B TAM tools help you model all three layers.
For fast-moving B2B markets, annual TAM recalculation is insufficient. Teams that revisit TAM assumptions more frequently are generally better positioned to respond to market changes and maintain competitive advantage. Best practice in 2026 is to use a platform that updates your TAM continuously based on real-time signals — hiring activity, technology adoption, funding events, and buying intent — rather than relying on periodic manual refreshes.
The five most important capabilities are: (1) data depth — how many enrichment fields you can filter on beyond basic firmographics, (2) signal coverage — whether the platform detects real-time buying signals or only provides static data, (3) automation — whether the tool handles qualification and activation or just delivers raw lists, (4) data freshness — how frequently records are updated and verified, and (5) integration ecosystem — how well the tool connects to your CRM and outreach stack.
Yes. AI-powered tools can significantly boost B2B campaign results through predictive analytics and real-time performance monitoring. For TAM identification specifically, AI can analyze thousands of enrichment attributes simultaneously to score and rank accounts by propensity to buy — a level of analysis that is impossible to replicate manually. Agentic AI platforms take this further by acting on the analysis autonomously, qualifying accounts and initiating outreach without human intervention.
Several platforms offer free tiers with limited functionality. Dealfront's Leadfeeder has a free plan for basic website visitor identification. Factors.ai offers a free tier for account intelligence. Clearbit provides limited free enrichment within HubSpot. However, free tools typically cap data access, limit enrichment fields, and restrict the number of accounts you can identify. For serious TAM identification at scale, paid platforms deliver significantly more depth and accuracy.
Top-down TAM starts with broad industry data from analyst firms (Gartner, Forrester, IDC) and applies geographic, demographic, and segment filters to estimate total market size. Bottom-up TAM starts with granular data — the number of companies matching your ICP multiplied by your average contract value (ACV). Bottom-up is more accurate and preferred by investors because it is grounded in verifiable company-level data. The best TAM identification tools automate bottom-up analysis by providing the enrichment data needed to count qualifying accounts precisely.
B2B contact data decays at approximately 2.1% per month, compounding to 22.5% to 30% annually. Professionals change jobs, phone numbers go stale, and email addresses become invalid at significant rates each year. This means a TAM built from static data in January is already missing a substantial share of its accuracy by year-end. Continuous enrichment and real-time signal updates are essential to maintaining a TAM that reflects current market conditions.
AI transforms TAM identification in three ways. First, machine learning can analyze thousands of enrichment attributes simultaneously to score and rank accounts by propensity to buy — a level of analysis impossible to replicate manually. Second, AI-powered platforms detect real-time buying signals (hiring patterns, technology adoption, funding events) that update your TAM continuously rather than quarterly. Third, agentic AI platforms go beyond scoring by acting on the analysis autonomously — qualifying accounts, initiating outreach, and creating a direct path from TAM identification to pipeline generation.

Tool and strategies modern teams need to help their companies grow.