.png)
.png)

Daniel Saks
Chief Executive Officer


Effective email marketing in 2025 isn't about sending more messages—it's about sending the right message to the right person at the right time. Prioritizing email audiences requires a strategic approach that balances signal strength, recency, and tech-stack fit to identify prospects most likely to convert. By focusing resources on high-probability opportunities, marketers can improve engagement rates, protect sender reputation, and drive measurable revenue growth.
The reality is stark: 95% of buyers are not actively solution-seeking at any given time, leaving only a small window to engage the 5% who are ready to buy. Without proper prioritization, teams waste valuable resources on cold leads while missing opportunities with prospects showing genuine buying intent. Tools like AI-qualified audience discovery help identify these high-intent prospects by analyzing behavioral signals, engagement patterns, and technology compatibility in real-time.
Email segmentation divides your audience into smaller groups based on shared characteristics, behaviors, or preferences. While basic segmentation improves relevance, audience prioritization goes further by ranking segments based on conversion probability. This distinction is critical: segmentation organizes your database, while prioritization determines where to invest your limited resources.
Prioritization matters because email marketing often reports strong ROI; for example, Litmus found an average up to $36 for every $1 spent, but this ROI depends entirely on targeting the right prospects. Without prioritization, teams face several challenges:
Mailchimp's analysis found segmented campaigns had 14.31% higher open rates and 100.95% higher click rates than non-segmented campaigns, but combining segmentation with intelligent prioritization delivers even greater returns. The goal is to move beyond basic demographic or firmographic segmentation to behavioral and intent-based prioritization that reflects real buying readiness.
While all four types have value, behavioral and firmographic data provide the strongest signals for email prioritization in B2B contexts.
Basic segmentation answers "Who is in my database?" while prioritization answers "Who should I contact first?" Prioritization requires:
This systematic approach ensures that your highest-value prospects receive immediate attention while lower-priority contacts enter appropriate nurture sequences.
Signal strength measures the intensity and quality of a prospect's buying intent indicators. Not all engagement is created equal—visiting a pricing page twice carries more weight than opening a newsletter once. High-intent signals reveal genuine interest in solving specific problems, making them powerful predictors of conversion likelihood.
The most reliable intent signals include:
Many B2B marketers report improved ROI when activating high-intent signals and tailoring marketing efforts accordingly. These signals indicate that prospects have moved beyond awareness into active evaluation, making them prime candidates for sales outreach.
Each category provides different insights into buyer intent, but website behavior and content engagement typically offer the strongest predictive power for email response.
Effective signal scoring requires weighting each indicator by its actual correlation to conversion. A simple framework assigns points based on historical performance:
This scoring system should be calibrated based on your specific conversion data, as signal importance varies by industry, product complexity, and sales cycle length.
Recency measures how recently a contact has engaged with your brand through email opens, clicks, website visits, or other interactions. Recent engagers are exponentially more likely to respond than cold contacts, making recency one of the strongest predictors of future engagement.
The principle is simple: customers who interacted recently are much more likely to engage again. If a customer hasn't engaged in months, they're more likely to ignore your next message. This decay curve varies by industry but generally follows predictable patterns.
A practical heuristic many teams use divides engagement into distinct windows for B2B email marketing:
If engagement trends low over time (e.g., no opens/clicks in 90–120 days), suppress or re-engage those contacts to protect deliverability. Follow Gmail/Yahoo deliverability guidelines and your ESP's deliverability guidance.
A practical recency scoring system uses percentile ranking:
This approach ensures that your most recent engagers receive priority attention while older contacts enter appropriate nurture or re-engagement sequences.
Technographic data—information about a company's technology stack, tools, and software usage—has become a crucial asset in B2B sales and marketing. Tech-stack fit helps prioritize prospects who already use compatible or competitive technologies, increasing conversion probability through relevance and timing.
When outreach demonstrates understanding of a prospect's technology environment, response rates increase dramatically. This is particularly important for:
Many B2B marketers use technographic data to identify competitive opportunities and target accounts that are not yet using their products or services.
Several methods can reveal a company's technology infrastructure:
These signals help identify prospects using specific platforms like Marketo, HubSpot, or Salesforce, enabling precise tech-stack targeting.
Tech-stack fit scoring should differentiate between complementary and replacement scenarios:
This nuanced approach ensures that outreach timing aligns with natural technology evaluation cycles and replacement windows.
Lead scoring assigns numerical values to prospects based on their likelihood to convert, enabling objective prioritization decisions. Effective lead scoring combines explicit factors (demographics, firmographics) to create a comprehensive view of buying readiness.
The most successful models use weighted scoring that reflects actual conversion correlations rather than arbitrary point assignments. This requires ongoing calibration based on real performance data.
Explicit scoring uses declared information like:
Implicit scoring uses behavioral data like:
While explicit data provides context, implicit data often proves more predictive of actual buying behavior. The best models combine both approaches with appropriate weighting.
HubSpot's native lead scoring provides a solid foundation but often requires customization for optimal results. Native scoring excels at:
However, custom models offer advantages in:
Most sophisticated B2B organizations supplement native scoring with custom models that incorporate external data sources and specialized scoring logic.
The Eisenhower Matrix, traditionally used for task prioritization, can be effectively adapted to email audience segmentation by plotting signal strength against recency. This creates four distinct quadrants that dictate specific action strategies.
Quadrant 1: High Signal, High Recency (Do First) These prospects show strong buying intent and have engaged recently. This quadrant represents your hottest leads and should be the primary focus of sales team efforts.
Quadrant 2: High Signal, Low Recency (Schedule) These prospects demonstrated strong intent but haven't engaged recently. Don't write off these prospects—they may simply be in a natural research phase of a longer buying cycle.
Quadrant 3: Low Signal, High Recency (Delegate) Recent engagers with low signal strength represent quick win opportunities. These contacts are receptive to communication and may develop stronger signals with proper nurturing.
Quadrant 4: Low Signal, Low Recency (Eliminate) Prospects with low signal strength and low recency should be entered into minimal-touch campaigns or suppressed. Continuing to send frequent messages to this segment can harm deliverability and waste resources.
This framework provides clear decision rules that align marketing and sales teams while protecting sender reputation.
Marketing automation platforms enable dynamic segmentation based on real-time signals, but their effectiveness depends on data quality and integration capabilities. Zoho Campaigns, HubSpot workflows, and Marketo engagement programs all support signal-based segmentation, but require proper configuration to maximize value.
The key challenge is ensuring that automation tools have access to comprehensive signal data. Many organizations struggle with data silos that prevent marketing automation platforms from seeing the full picture of prospect engagement.
HubSpot excels at:
Zoho Marketing Automation offers:
Marketo provides:
Regardless of platform choice, the critical success factor is feeding comprehensive signal data into the system. This is where complementary data intelligence layers become essential.
Zoho's platform supports technographic segmentation through custom properties and integration with third-party data providers. Marketers can:
However, Zoho relies on external data sources for comprehensive technographic intelligence, making integration with specialized data providers crucial for effective tech-stack targeting.
Creating an effective prioritization model doesn't require sophisticated AI—just systematic application of objective criteria. Start with a simple framework and refine based on performance data.
Begin by inventorying all available signals across your technology stack:
Categorize each signal by reliability and conversion correlation based on historical data.
Use past conversion data to assign weights to each signal category:
A typical starting point might be:
Implement your model with a pilot segment and measure results:
Don't aim for a "perfect" model—aim for a responsive one. Even modest improvements in prioritization accuracy can deliver significant ROI gains.
The most effective prioritization models combine all three factors into a single composite score that drives resource allocation decisions. This requires normalization to prevent any single factor from dominating the overall score.
Priority Score = (Signal Strength × 0.5) + (Recency Score × 0.3) + (Tech-Stack Fit × 0.2)
Where each component is normalized to a 0-100 scale:
This weighted approach ensures that high-intent signals carry the most weight while still accounting for timing and technology relevance.
Optimal weight distribution varies by context:
Regular testing and calibration ensure that weights remain aligned with actual conversion patterns.
Effective prioritization must translate into specific campaign strategies that match messaging depth and frequency to priority level. High-scoring segments warrant white-glove treatment while lower-scoring segments need appropriate nurturing approaches.
For prospects scoring in the top 20%:
For prospects scoring in the 21-60% range:
For prospects scoring below 20%:
Natural-language audience building allows marketers to quickly generate campaign-ready segments like 'CMOs at cybersecurity startups adding marketing automation tools' without manual filtering, ensuring precise targeting from the start.
Success measurement must go beyond basic email metrics to focus on business outcomes and model accuracy. The right KPIs validate your prioritization approach and guide continuous improvement.
Key comparison metrics include:
Prioritized campaigns should significantly exceed baseline benchmarks when properly implemented.
Prioritization models require ongoing monitoring for accuracy:
Regular model validation ensures that your prioritization remains aligned with actual buyer behavior.
Even well-designed prioritization models can suffer from implementation challenges. The most common pitfalls include data quality issues, subjective scoring, and operational complexity.
Over-segmenting can lead to tiny audiences, making it difficult to scale campaigns or see meaningful results. Focus on larger, actionable segments at first, then refine as your data grows. Start with 3-5 key segments based on the three-pillar framework, then refine over time as data and resources allow.
Key thresholds to monitor:
Consider consolidating segments when:
The goal is optimal segmentation—not maximum segmentation. Focus on the 20% of segmentation efforts that drive 80% of your results.
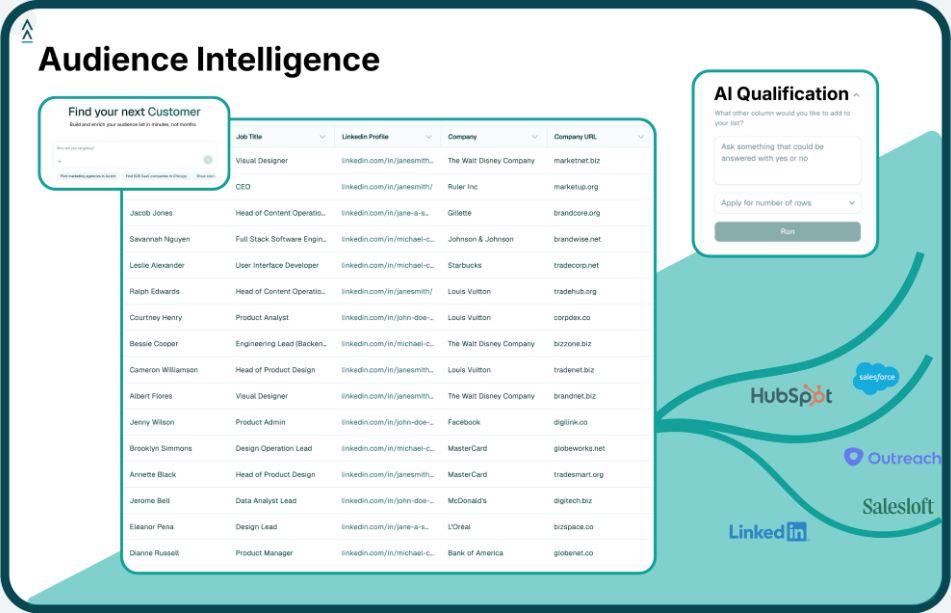
While traditional marketing automation tools provide the foundation for email prioritization, they often lack access to comprehensive, real-time signal data. Landbase addresses this gap with a frictionless audience builder powered by GTM-2 Omni, an agentic AI model built for go-to-market automation.
Landbase enables marketers to type a plain-English prompt and receive an AI-qualified export—check current limits and access requirements. This approach eliminates the manual filtering and complex workflows that traditionally slow down audience building.
Real-time signal integration: Landbase monitors a comprehensive set of real-time signals including website visitor intelligence, intent tracking, and market event monitoring to identify high-intent prospects automatically. Unlike static databases, Landbase's dynamic signal layer reflects current buying readiness.
Natural-language targeting: Instead of navigating complex filter menus, marketers can simply describe their ideal audience in plain English: "CMOs at cybersecurity startups (51–200 employees) adding new marketing automation tools." The platform's AI Qualification ensures precision through both online and offline validation.
Tech-stack detection: Landbase tracks technology adoption across multiple categories, including detecting users of platforms like Marketo, HubSpot, and Salesforce for precise tech-stack targeting. This capability enables competitive displacement and integration-focused campaigns with unprecedented accuracy.
Immediate activation: AI-qualified audiences export to major CRMs/automation tools like HubSpot and Salesforce. This seamless integration ensures that prioritized audiences can be activated immediately without manual data handling.
Landbase's free, no-login audience builder represents a fundamental shift in how marketers access and prioritize prospect data—moving from manual, time-intensive processes to instant, AI-qualified exports that drive measurable revenue impact.
Segmentation organizes your audience into groups based on shared characteristics like demographics, firmographics, or behavior, while prioritization ranks those segments by conversion probability and buying readiness. Segmentation answers "Who is in my database?" while prioritization answers "Who should I contact first?" The best email strategies combine both: segmentation creates meaningful groups, and prioritization determines resource allocation and outreach timing.
Start with 5-10 high-correlation signals rather than tracking everything available, focusing on signals that strongly predict conversion in your specific context. Pricing page visits, demo requests, case study downloads, and email engagement patterns typically provide the strongest predictive power for B2B companies. Track fewer signals well rather than many signals poorly, and calibrate weights based on your actual conversion data over time.
The optimal recency window varies by sales cycle length, but a practical heuristic divides prospects into Hot (0-14 days), Warm (15-60 days), Cool (61-180 days), and Cold (180+ days). High-intent prospects in the hot window should receive immediate sales attention, while cooler prospects need appropriate nurture sequences. Adjust these windows based on your industry, product complexity, and historical engagement patterns to optimize results.
Yes, the Eisenhower Matrix adapts perfectly to email prioritization by plotting signal strength (urgent) against recency (important), creating four actionable quadrants. This creates Do First (high signal, high recency), Schedule (high signal, low recency), Delegate (low signal, high recency), and Eliminate (low signal, low recency) segments. Each quadrant dictates specific action strategies—from immediate sales outreach for hot leads to minimal-touch campaigns for cold contacts—providing clear decision rules that align marketing and sales teams.
Tech-stack fit improves targeting accuracy by identifying prospects who already use compatible or competitive technologies, making them more likely to need your solution at the right time. Many B2B marketers use technographic data to identify competitive opportunities, target accounts for integration plays, and time outreach around natural technology evaluation cycles. For example, knowing a prospect uses a competitor's product enables competitive displacement messaging, while knowing they use complementary tools enables integration-focused value propositions.
There's no universal threshold—your MQL criteria should be calibrated based on actual conversion data and sales team capacity in your specific business. Start by analyzing which lead scores correlate with 10-20% conversion rates to sales-accepted opportunities, then adjust thresholds based on sales feedback and win rates. Continuously refine your threshold by monitoring MQL-to-SQL conversion rates and sales cycle velocity, ensuring that only truly qualified leads consume sales resources.

Tool and strategies modern teams need to help their companies grow.