.png)
.png)

Daniel Saks
Chief Executive Officer


Effective lead prioritization starts with understanding how to properly weight the three core dimensions of email engagement: recency, frequency, and intensity. Email signal scoring models that balance all three dimensions significantly outperform single-dimension approaches in prediction accuracy. By systematically evaluating how recently prospects engaged, how often they interact, and the depth of their actions, B2B teams can identify high-intent buyers with precision.
The challenge lies in determining optimal weight distributions that match your specific sales cycle and business context. While some organizations over-index on recent activity and miss sustained interest patterns, others fail to distinguish between passive opens and high-value actions like demo requests. Landbase's agentic AI leverages these same principles across 1,500+ signals to identify prospects showing genuine buying intent.
This tactical guide provides a framework for calibrating recency, frequency, and intensity weights based on empirical data and business requirements, helping you build scoring models that drive actual revenue outcomes rather than vanity metrics.
Email signal scoring transforms raw engagement data into actionable intelligence by assigning weighted values to different types of prospect interactions. The framework evaluates three core dimensions: recency (how recently someone engaged), frequency (how often they interact over time), and intensity (the depth and value of their actions). This RFI approach moves beyond basic metrics like open rates to create composite scores that predict buying readiness with significantly higher accuracy.
Recency captures the time-sensitive nature of buying intent. Research shows that email engagement signals lose significant predictive value over time without reinforcement, making timing a critical factor in identifying prospects in active buying windows.
Frequency measures sustained interest patterns rather than one-time interactions. Organizations find that frequency-based signals with multiple engagements correlate with higher conversion rates than single-touch engagements, indicating genuine interest versus random browsing.
Intensity differentiates between passive and active engagement. High-intensity actions like content downloads, demo requests, and pricing page visits provide much stronger intent signals than passive behaviors like email opens. Properly weighted intensity prevents false positives from inflated scores based on unreliable metrics.
Organizations implementing balanced RFI scoring report improved sales team efficiency and significantly better lead quality. The structured approach ensures sales teams focus on prospects showing genuine buying signals rather than chasing stale high-frequency contacts or one-time recent engagers.
Without proper weighting, scoring models become unreliable. Over-emphasizing recency creates "whack-a-mole" behavior where sales teams chase every new engagement regardless of intent depth. Under-weighting intensity treats all engagements equally, artificially inflating scores for passive behaviors that don't correlate with actual conversion probability.
Recency is often the most powerful predictor of near-term behavior, but its accuracy relies on applying the right time decay functions matched to your sales cycle velocity. However, recency alone cannot distinguish truly interested prospects from casual or one-time visitors; combining recency with frequency is essential to separate genuine engagement from random browsing.
The half-life of engagement signals varies significantly by industry and sales cycle length. Optimal recency windows vary by industry, with shorter windows for B2C and longer windows for B2B. Enterprise B2B sales with 6-12 month cycles can use gentler decay rates, while high-velocity transactions require steeper decay curves to maintain signal relevance.
To determine your optimal recency window, calculate the median time-to-conversion from first engagement across historical deals. Set your recency half-life at 25-33% of this duration. For example, if your typical sales cycle is 90-120 days, a 30-day half-life would be appropriate.
Time decay functions mathematically reduce the value of older signals while preserving newer ones. Common approaches include:
The exponential decay formula (score = base_score × e^(-decay_rate × days_since_engagement)) provides the most realistic reflection of signal deterioration over time. Organizations typically test different decay rates to find what best matches their sales cycle velocity.
Landbase's GTM-2 Omni analyzes real-time intent signals across 1,500+ data points including email engagement timing to identify prospects in active buying windows, automatically applying appropriate decay functions based on industry and sales cycle patterns.
Frequency signals provide crucial context that distinguishes sustained interest from one-time curiosity. However, frequency calculations require sufficient data points to achieve statistical reliability, creating a tension between timely scoring and data quality.
Effective frequency measurement requires collecting enough engagement data points over time to establish reliable patterns. This creates implementation challenges for organizations needing timely lead scoring without waiting extended periods for sufficient data accumulation.
Effective frequency thresholds typically follow these patterns:
Organizations find that frequency-based signals with multiple engagements correlate with higher conversion rates than single-touch engagements, validating the importance of setting appropriate thresholds.
Not all frequent engagers represent genuine buying intent. Some prospects may consistently open emails without taking meaningful actions, creating false positives in scoring models. To avoid this pitfall:
The goal is to identify prospects showing both consistency and progression in their engagement patterns, not just passive recipients who happen to open emails regularly.
Intensity weighting prevents false positives by ensuring high-value actions receive appropriate recognition in scoring models. The biggest mistake in scoring is treating all engagements equally—a content download is fundamentally different from an email open.
Effective intensity hierarchies map trackable actions to multipliers based on effort required and intent indicated:
Research confirms that high-intensity signals like downloads and registrations have significantly higher conversion correlation than low-intensity signals like opens. In enterprise scoring systems, intensity weighting can range from baseline for opens to substantially higher for demo requests as an illustrative example.
Landbase's platform tracks website visitor intelligence including pricing page visits and demo request behaviors to score engagement intensity and identify high-intent prospects automatically.
The most significant intensity weighting error in 2025 is continuing to weight email opens heavily despite their declining reliability. Apple Mail Privacy Protection and similar features cause automated opens that don't reflect actual human engagement, making opens increasingly unreliable as intent signals.
Other common mistakes include:
No universal "correct" weight distribution exists—optimal ratios depend entirely on your business context, sales cycle length, and conversion patterns. However, research provides baseline frameworks that can be refined through data analysis.
Research shows that recency typically receives substantial weighting in high-performing models, reflecting its importance as a predictor of near-term behavior.
Favor recency weighting when:
However, marketing analytics research suggests that time decay parameters should align with your typical sales cycle—for instance, using a 30-day decay window for a 180-day sales cycle can under-score early-stage prospects and distort lead prioritization.
Your scoring model must align with your actual sales motion and deal characteristics. High-velocity B2B transactions require different weighting than enterprise deals with 6-12 month cycles and complex buying committees.
For sales cycles under 30 days, implement recency-dominant models with aggressive decay rates. These models should emphasize recent high-intensity actions and respond quickly to engagement spikes. Frequency becomes less important when decisions happen rapidly, but intensity remains crucial for distinguishing genuine interest from casual browsing.
Long sales cycles require gentler decay rates and greater emphasis on frequency and intensity patterns. Enterprise prospects often engage multiple times over months before making decisions, so sustained interest signals become more valuable than recent activity alone. Account-level scoring that aggregates engagement across multiple stakeholders within target organizations becomes essential.
Analyses across B2B sales operations indicate that maintaining a balanced RFI (Recency–Frequency–Intensity) model can enhance sales team focus and efficiency—provided the weighting scheme reflects the actual sales cycle length and engagement dynamics.
Modern scoring models must incorporate signals beyond email to create comprehensive engagement profiles. Cross-channel behavior provides crucial context that validates or contradicts email engagement patterns.
Website visitor intelligence significantly enhances email scoring accuracy by providing behavioral context. Key signals include:
Landbase's GTM-2 Omni combines email engagement with 1,500+ firmographic signals to generate composite engagement scores across channels, automatically correlating email behavior with website activity to identify genuine buying intent.
LinkedIn engagement, social shares, and comment activity provide additional validation of prospect interest. When email engagement correlates with social signals, confidence in scoring accuracy increases significantly. However, social signals should typically receive lower weights than direct engagement actions (email clicks, website visits) since they require less effort and intent.
Even well-designed scoring models can fall prey to common implementation errors that reduce effectiveness and create false positives.
Email opens have become increasingly unreliable due to privacy protection features like Apple Mail Privacy Protection, which automatically loads images and triggers open tracking regardless of actual human engagement. Many organizations now exclude opens entirely from scoring calculations or assign minimal weight to account for their limited predictive value.
Bot traffic, email client pre-fetching, and automated systems can artificially inflate engagement metrics. Implement these safeguards:
The only true measure of scoring model effectiveness is its correlation with actual conversion outcomes. Regular validation and optimization ensure your model remains accurate as market conditions and customer behavior evolve.
Implement A/B testing frameworks to validate weight adjustments before full deployment:
Conduct retrospective analysis of won/lost deals to identify optimal weight ratios:
Organizations that regularly review and adjust scoring weights see better lead quality metrics, demonstrating the importance of continuous optimization.
Manual scoring processes quickly become unsustainable as prospect databases grow. Automated signal collection and real-time score updates ensure your team always works with the most current engagement data.
The key is matching your update frequency to your sales cycle velocity and team workflow requirements.
Landbase's platform provides real-time signal detection across 210M contacts, with exports up to 10,000 AI-qualified contacts ready for CRM activation, eliminating manual list building and ensuring teams always work with current, qualified prospects.
Different GTM strategies require tailored scoring approaches that reflect their unique engagement patterns and conversion drivers.
PLG motions emphasize user behavior within the product itself, making intensity the dominant scoring dimension:
ABM requires tracking engagement across multiple stakeholders within target accounts:
High-volume outbound prioritizes recent engagement to enable rapid follow-up:
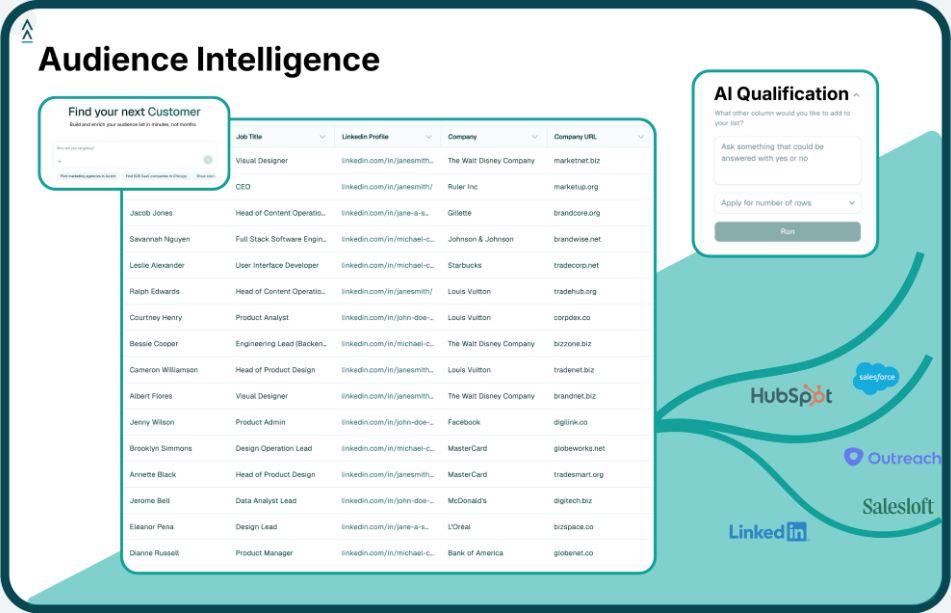
For teams struggling with manual prospect list building and outdated data, Landbase offers a fundamentally different approach to audience discovery. Instead of wrestling with complex filters and unreliable databases, users simply type a prompt and receive an AI-qualified export of up to 10,000 contacts in seconds.
Landbase's GTM-2 Omni agentic AI analyzes 1,500+ dynamic signals—including real-time intent data, technographic changes, and engagement patterns—to identify prospects showing genuine buying intent. The platform's AI Qualification process ensures that exported contacts match both your ideal customer profile and current buying signals, delivering precision that static databases cannot match.
The free, no-login Vibe experience eliminates the friction typically associated with audience building, allowing teams to generate qualified lists instantly without complex setup or credit purchases. This focus on speed, quality, and zero-friction UX makes Landbase particularly valuable for teams needing to quickly build targeted audiences for time-sensitive campaigns or rapidly changing market conditions.
By automating the audience discovery process while maintaining rigorous qualification standards, Landbase enables sales and marketing teams to focus their energy on high-value conversations rather than manual list building and data validation.
Recency measures how recently someone engaged with your content, frequency tracks how often they interact over time, and intensity evaluates the depth and value of their actions (opens vs. demo requests). All three dimensions provide different insights into buying intent and must be weighted appropriately for your specific business context. Together, they create a comprehensive view of prospect engagement that single-dimension scoring cannot achieve.
If your sales team is constantly chasing one-time engagers who don't convert, or if you're missing prospects with sustained but less recent engagement patterns, you're likely over-weighting recency. Review your conversion data by score decile—if high-scoring leads aren't converting at expected rates, consider reducing recency weight and increasing frequency or intensity emphasis. Testing different weight distributions with historical data can reveal the optimal balance for your business.
Email opens have become increasingly unreliable due to privacy protection features like Apple Mail Privacy Protection that trigger automatic open tracking. Most sophisticated scoring models now exclude opens entirely or assign minimal weight compared to more reliable signals like clicks, downloads, or form submissions. Focus instead on actions that demonstrate genuine human engagement and intent.
Update frequency should match your sales cycle velocity. High-velocity B2B sales (under 30 days) benefit from real-time score updates, while enterprise deals with 6-12 month cycles can use daily or weekly batch updates. The key is ensuring your team works with sufficiently current data to identify prospects in active buying windows without creating unnecessary system overhead.
A balanced starting point for B2B SaaS is 40% recency, 30% frequency, and 30% intensity. This reflects research showing that recency typically receives substantial weighting in high-performing models due to its predictive power for near-term behavior. Collect 90 days of conversion data, then adjust weights based on which dimensions best predict outcomes in your specific context.
For enterprise sales cycles of 6+ months, implement gentler decay rates, increase frequency weighting to capture sustained interest patterns, and consider account-level scoring that aggregates engagement across multiple stakeholders within target organizations. Focus on relationship development signals rather than urgency-driven metrics, and use longer time windows for all three dimensions to reflect the extended decision-making process.

Tool and strategies modern teams need to help their companies grow.